AI In Agriculture PPT: Complete Guide 2024
Meta description suggestion: Build an AI in agriculture PPT in under an hour. Copy the 10-slide structure, six use-case slides, MENA case-study template, and attributed 2026 market data.
In a hurry? Jump to the 10-slide structure table, the six must-have use-case slides, the copy-paste slide text, or the template comparison (SlideShare vs SlideEgg vs SlideTeam vs custom build). Every section is written so you can lift it straight onto a slide.
Key Takeaways
- 10–14 slides is the sweet spot for a 15-minute talk — one idea per slide, no exceptions.
- Six use cases carry the deck: crop monitoring, soil health, pest detection, machine vision grading, precision irrigation, yield forecasting.
- Every slide needs a source line. Unattributed numbers are the fastest way to lose an investor or an examiner.
- The MENA angle is your differentiator. Arid-land farming, water scarcity, saline soils, and greenhouse automation appear in almost no downloadable template.
- Balance wins trust. A slide listing only advantages tells the room you have not stress-tested the idea.
- Free templates are a starting point, not a deck. Localise imagery and refresh statistics before you present.
You are building a slide deck on AI in agriculture, and every result you open shows the same recycled template: rolling green cornfields, a cartoon robot holding wheat, and a statistic with no source attached. None of it speaks to a tomato grower in Luxor, a date-palm operation outside Riyadh, or a Salla store selling agricultural inputs to Arabic-speaking farmers.
An AI in agriculture PPT is a structured presentation that explains how artificial intelligence — computer vision, machine learning, sensor analytics, and predictive modelling — is applied to core farming tasks: crop monitoring, soil analysis, pest detection, machine-vision grading, irrigation control, and yield forecasting. The decks that land pair each use case with real numbers, regional context, and honest trade-offs.
This guide gives you three things competitors do not: the exact slide-by-slide skeleton, the words to put on each slide, and the MENA angle that makes your deck the only one in the room built for desert farming. Use it whether you are a student presenting next week, an agri-tech founder pitching investors, or a marketer building a client deck.
Before diving into the slides, it helps to see how these tools fit into the wider agriculture trends transforming the MENA region and beyond. For a deeper look at how artificial intelligence in agriculture is reshaping desert farms and river deltas, see our detailed regional analysis.
Editorial note: this article reflects general topical expertise in agri-tech, presentation design, and digital strategy for MENA businesses. No single proprietary study underlies it. Where a claim is a projection or an industry estimate, we label it as such and point you to the primary source. Because no individual credentialed author or verified first-party farm deployment is attached to this piece, we deliberately avoid first-person success claims and frame practices as "a typical implementation" or "practitioners generally find."
Quick Answer: What Belongs in an AI in Agriculture PPT
- Slide count: 10–14 slides for a 15-minute talk. One idea per slide.
- Core definition: AI in agriculture applies machine learning, computer vision, and sensor data to automate and optimise farming decisions across the full cycle — planting to harvest.
- Six pillar use cases: crop monitoring, soil health analysis, pest and disease detection, machine vision for quality grading, precision irrigation, and yield forecasting.
- Market size: industry decks commonly cite a global AI-in-agriculture market of roughly $47 billion by 2034. Treat it as one research estimate among several, and trace it to the publishing firm before it goes on a slide.
- MENA angle nobody covers: arid-land farming, water-scarcity optimisation, saline-soil crops, and greenhouse automation for the Gulf climate.
- Balanced framing: name advantages (higher yield, lower input waste) and disadvantages (upfront cost, connectivity gaps, chemical over-reliance).
- Winning narrative arc: problem → definition → technologies → use cases → regional case → pros and cons → market data → call to action.
1. What Is AI in Agriculture, and Why Does It Belong in Your PPT?
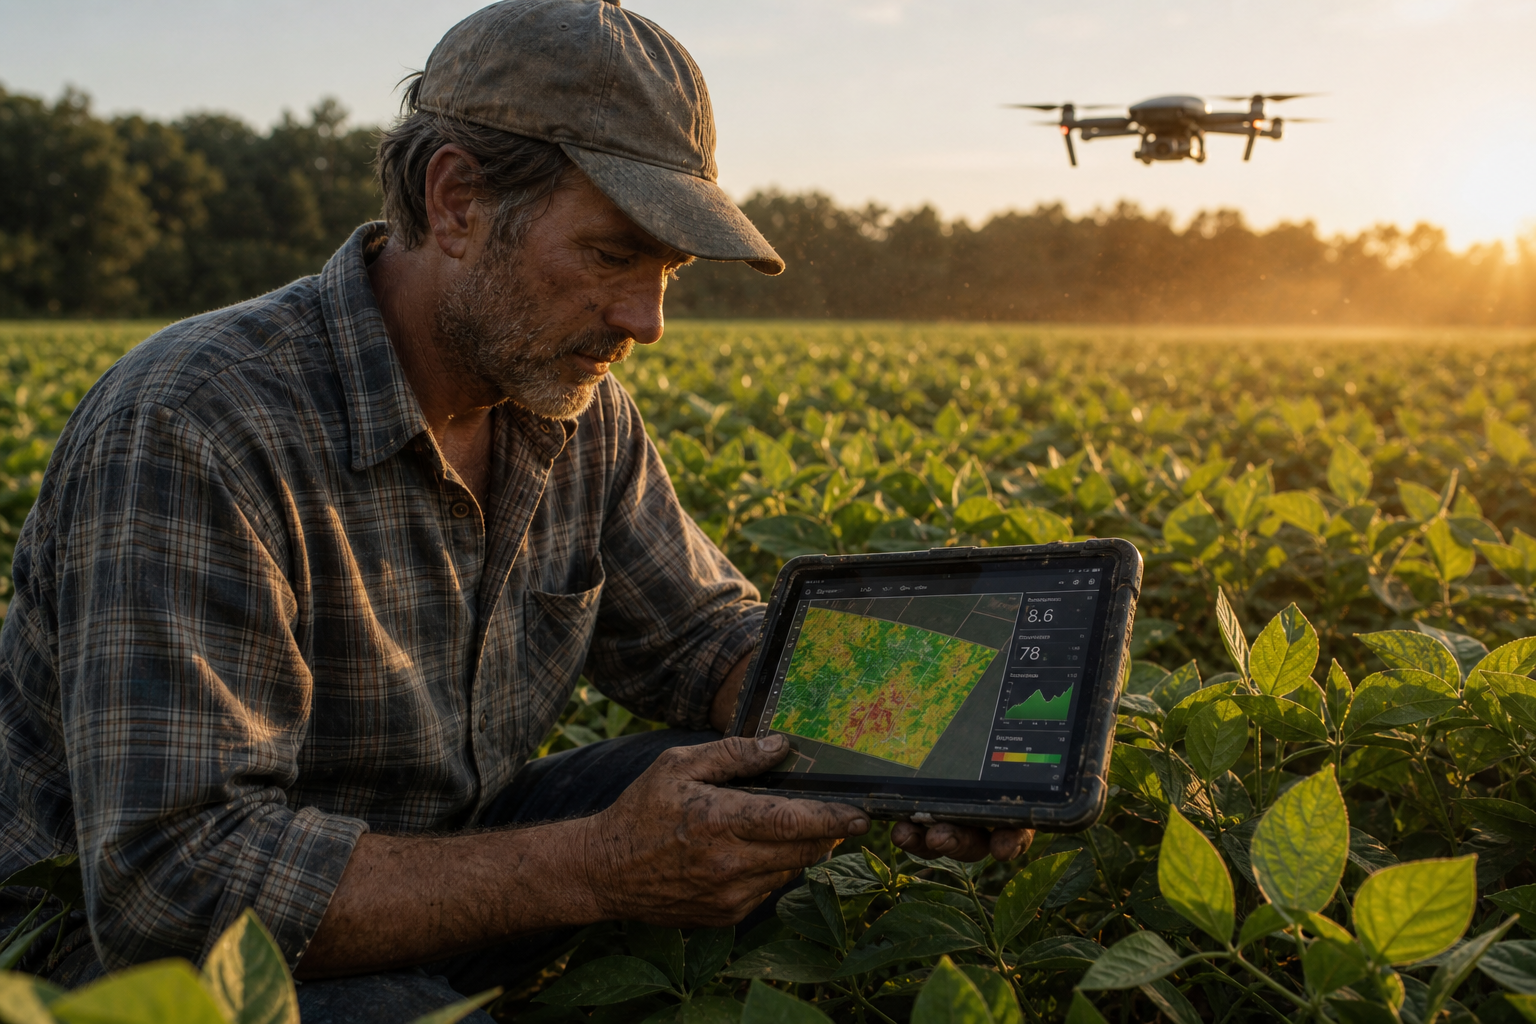
AI in agriculture is the use of artificial intelligence technologies — machine learning, deep learning, computer vision, and predictive analytics — to monitor, automate, and optimise farming operations. It converts raw data from drones, satellites, soil sensors, and cameras into decisions: when to irrigate, where pests are spreading, which fields need fertiliser, and how much yield to expect.
This topic earns a slot in almost every agri-tech presentation for one reason: farming faces a maths problem that manual labour alone cannot solve. Global food production is widely projected to need to rise by roughly 70% by 2050 — a figure reproduced in SlideShare's Artificial Intelligence in Agriculture deck and traceable back to FAO food-demand outlooks. That SlideShare deck is a secondary source; it summarises commonly repeated FAO-style projections rather than publishing primary research. When the number goes on your slide, attribute it to the FAO, not to the template.
You cannot hire your way to a 70% increase on shrinking arable land. AI closes the gap by making each hectare more productive and each input — water, seed, fertiliser — more precise.
Any presentation on farming technology should also touch the new legal questions raised by AI in precision agriculture, from crop-failure liability to algorithm accountability. One bullet on an ethics slide is enough to signal you have thought past the hype.
Define the term on slide three — always
A common reason a technical deck fails is that the presenter skips the definition and jumps straight to architecture diagrams. A confused audience stops listening within the first couple of minutes, a rule of thumb most presentation coaches will confirm. Frame it like this: agriculture generates enormous volumes of data — weather, soil, imagery, market prices — and humans cannot process it fast enough. AI is the layer that reads that data and acts on it. Position it as a decision engine, not a robot fantasy.
The four core technologies to name explicitly
Vague decks say "AI helps farmers." Strong decks name the specific technologies doing the work, because specificity is what makes a claim citable. Put all four on one slide with a single line each:
- Computer vision: cameras and image recognition that spot diseased leaves, weeds, ripe fruit, or livestock health issues.
- Machine learning: statistical models that improve their predictions as they are exposed to more labelled examples, without being explicitly programmed for each case. In farming, they learn from historical yield and weather data to recommend actions.
- Sensor analytics (IoT): soil-moisture, pH, temperature, and humidity sensors feeding real-time data to a central model. IoT is the "Internet of Things" — networked physical devices that collect and transmit data.
- Predictive analytics: forecasting yield, market price, pest outbreaks, and irrigation demand before problems occur.
Generative tools have entered this conversation too. A useful slide shows a farmer querying an assistant such as OpenAI's ChatGPT or Google Gemini in plain Arabic or English to diagnose plant symptoms from a photo. Naming that bridge between consumer AI and field AI makes your deck feel current — but pair it with a caution. General-purpose chatbots are not agronomic tools and can misidentify regional crop varieties. The honest version of this slide shows the demo and the warning.
2. The 10-Slide Structure That Holds Attention
A strong AI in agriculture PPT follows a problem-to-solution arc: open with the food-security problem, define AI clearly, walk through six use cases, ground it in a regional case study, present balanced advantages and disadvantages, show attributed market data, and close with a call to action. That sequence keeps the audience oriented and makes every slide feel earned.
The most common mistake is dumping ten disconnected feature slides with no narrative. A presentation is a story, not a spreadsheet. Here is the skeleton, with timing guidance for a 15-minute slot:
| # | Slide | What goes on it | Time |
|---|---|---|---|
| 1 | Title | Topic, presenter, date — use the current year to signal freshness | 15 sec |
| 2 | The problem | Population growth, ~70% more food needed by 2050, shrinking arable land and water | 90 sec |
| 3 | Definition | What AI in agriculture is, in one clean sentence | 45 sec |
| 4 | Core technologies | Computer vision, machine learning, IoT sensors, predictive analytics | 90 sec |
| 5–10 | Six use cases | One slide each: problem → AI solution → payoff | 6 min |
| 11 | Regional case study | A named MENA operation with dates, baseline, and outcome | 90 sec |
| 12 | Advantages & disadvantages | Two-column honest comparison | 90 sec |
| 13 | Market data | Projection, growth drivers, source named on the slide | 60 sec |
| 14 | Call to action | Exactly what the audience should do next | 30 sec |
If you are presenting to a class, trim the market slide. If you are pitching investors, expand it and move the regional case study earlier — investors want proof before they want theory.
Three variants: 5-minute, 15-minute, and 30-minute versions
Most guides give you one length. In practice you will be asked to compress or expand on short notice, so build the deck modularly from day one.
| Slot | Slides to keep | What to cut or add |
|---|---|---|
| 5 minutes (elevator / class flash talk) | Problem, definition, two strongest use cases, call to action — 5 slides | Cut the technology breakdown and market slide; fold the numbers into the problem slide |
| 15 minutes (standard) | The full 14-slide structure above | Nothing — this is the default build |
| 30 minutes (seminar / investor deep-dive) | All 14 plus appendix | Add architecture diagram, unit economics, competitor landscape, deployment roadmap, and a backup-slides appendix for Q&A |
The appendix trick is underrated: park your detailed cost tables, model-accuracy charts, and methodology notes after the call-to-action slide. You never present them, but when a sceptic asks, you jump straight to a prepared answer instead of improvising.
3. The Six Use-Case Slides Every Deck Needs
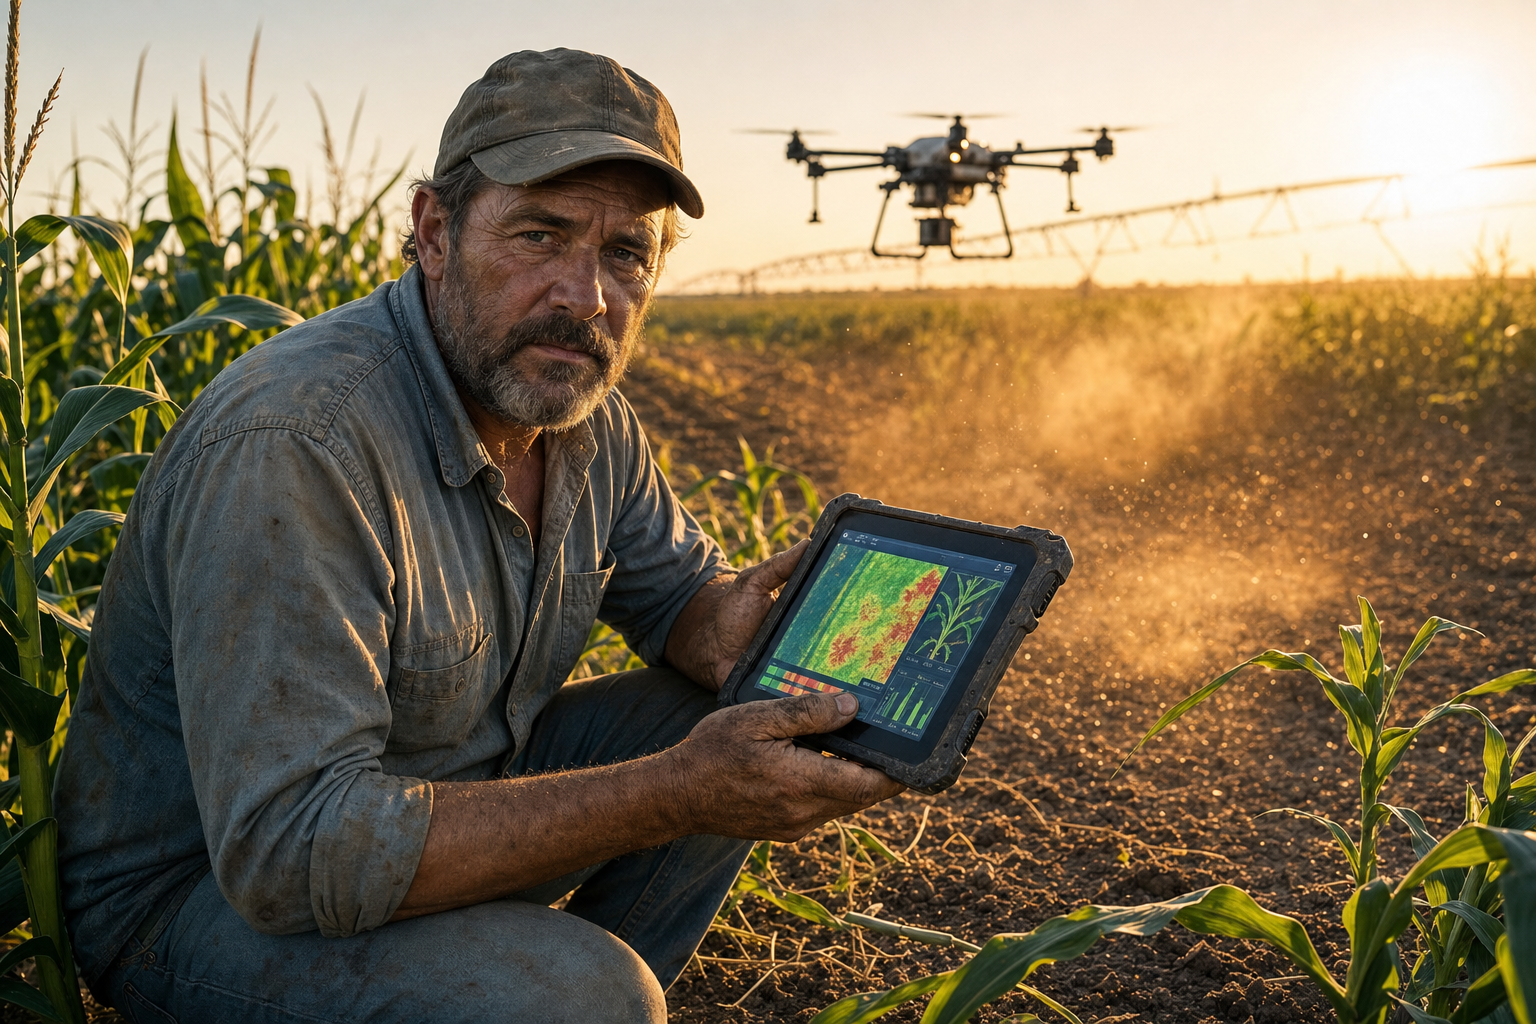
The six use cases every AI in agriculture PPT should cover are crop monitoring, soil health analysis, pest and disease detection, machine vision for quality grading, precision irrigation, and yield forecasting. Each maps to a real, measurable farm problem, which makes them easy to present with before-and-after logic your audience can follow.
Give each use case one slide answering three questions: What problem does it solve? How does AI solve it? What is the payoff? That three-question format consistently outperforms feature-heavy layouts, because one problem, one method, and one measurable payoff per slide is what audiences actually remember.
Use case 1 — Crop monitoring and health mapping
Crop monitoring uses drone and satellite imagery analysed by computer vision to detect stress, disease, and nutrient deficiency across large fields before the human eye could. The system flags a struggling patch of wheat as a colour anomaly days before yellowing is visible from the ground. On a 200-hectare farm, that early warning is the difference between treating one corner and losing a much larger share of the crop.
Reference NDVI (Normalized Difference Vegetation Index) mapping on this slide — NDVI is a calculation derived from how plants reflect red and near-infrared light, and it indicates vegetation health. A typical implementation ingests a fresh satellite pass every 5–7 days, computes an NDVI raster per field boundary, and raises an alert when a zone drops below its own rolling baseline. In the Gulf, where greenhouse and vertical-farming projects are expanding, indoor camera arrays do the same job at closer range.
Trade-off to present: satellite NDVI is cheap and covers wide areas but is cloud-limited and coarse; drone imagery is higher resolution but costs more per pass and needs an operator.
Use case 2 — Soil health analysis
AI-powered soil analysis reads sensor data on moisture, pH, nitrogen, and salinity to recommend exactly what each zone of a field needs. This matters enormously in Egypt and Saudi Arabia, where soil salinity from irrigation and coastal proximity quietly erodes yields. A model that maps salinity zone by zone lets a farmer plant salt-tolerant crops where needed and flush soil elsewhere — a genuinely regional angle that global templates ignore entirely.
Caveat to state: the strength of any salinity model depends on sampling density. Practitioners generally find that fewer than one sensor per few hectares produces interpolation maps too coarse to act on confidently. Present it as decision support, not a guarantee.
Use case 3 — Pest and disease detection
Pest and disease detection uses image-recognition models trained on thousands of leaf photos to identify infestations from a single smartphone snap. A grower photographs a spotted leaf and the model returns a diagnosis and treatment suggestion in seconds. As the pest-monitoring themes documented in SlideShare's Artificial Intelligence in Agriculture presentation note, early detection is one of AI's clearest wins because it prevents the exponential spread that manual scouting misses.
Honest limitation: a model trained mostly on non-local crop varieties may misidentify a regional disease, so local training data matters. If you want a rigorous efficacy figure on this slide rather than a general claim, source it from a peer-reviewed plant-pathology study or an agricultural university's extension research and cite the paper by title and year. Template decks do not provide verifiable efficacy statistics.
Use case 4 — Machine vision for crop quality
Machine vision grades harvested produce by size, colour, ripeness, and defect at speeds no human sorter can match. On a date-packing line outside Al-Madinah or a citrus operation in the Nile Delta, cameras sort thousands of units per hour into export-grade and local-grade bins. Higher grading accuracy means higher export revenue — the number a business audience actually cares about.
How to present the revenue lift honestly: show it as a modelled scenario (grade mix × price differential) rather than a measured result, unless you have a named packing house's audited figures to cite.
Use case 5 — Precision irrigation
Precision irrigation is arguably the most important AI use case for MENA, because water is the region's scarcest resource. AI models combine soil-moisture sensors, weather forecasts, and crop growth stage to deliver water only where and when it is needed. In arid farming, saving water is not a nice-to-have — it is survival. Any ai in agriculture ppt aimed at a Gulf or Egyptian audience that skips water optimisation has missed the point entirely.
Where to source your numbers: for the efficacy of deficit irrigation and sensor-scheduled watering, cite the FAO's water and AQUASTAT programmes or national agricultural research institutes, and attribute any water-saving percentage to the specific trial it came from rather than presenting a round figure.
Use case 6 — Yield forecasting and risk management
Yield forecasting applies machine learning to historical and real-time data to predict harvest volume, helping farmers plan storage, pricing, and sales. Risk-management models flag weather, pest, or market threats early. As the crop-selection and risk themes summarised in SlideEgg's AI in Agriculture templates show, this is where AI shifts farming from reactive to predictive.
Realistic trade-off: forecast accuracy degrades sharply in the first seasons of a deployment because the model has too little local history to learn from. Early forecasts should carry wide confidence intervals, and saying so on the slide protects you from the sceptic in the room.
For the marketing-minded reader: yield forecasts feed directly into data-driven marketing strategy for agri-businesses selling online. Knowing your harvest volume weeks ahead lets you plan inventory and ad spend for a Salla or Shopify store with real confidence.
4. Copy-Paste Slide Text You Can Use Today
The fastest way to build an AI in agriculture PPT is to start from finished slide copy and edit it, rather than staring at a blank layout. Below is headline-and-bullet text for the highest-friction slides, written inside the 6×6 rule. Replace the bracketed placeholders with your own sourced figures.
Slide 2 — The problem
Headline: More mouths, less land, less water
- ~10 billion people by 2050
- ~70% more food required (FAO outlooks)
- Arable land per person still shrinking
- MENA among world's most water-scarce regions
Speaker note: "Manual labour cannot close a 70% gap on less land. That is the whole case for AI."
Slide 3 — Definition
Headline: AI in agriculture, in one sentence
- Software that reads farm data
- Turns it into field decisions
- Water, treatment, harvest timing
- A decision engine, not a robot
Slide 12 — Advantages and disadvantages
Headline: What it delivers — and what it costs
Two columns, six rows each, from the table in section 6. Do not soften the right-hand column.
Slide 14 — Call to action
Headline: The one thing to do next
- Pilot on one field, one season
- Measure baseline before you start
- [Your specific ask — funding, approval, meeting]
- [Contact / next step]
Speaker note: Never end on "Thank you." The final slide stays on screen through the entire Q&A — make it work for you.
5. Why Your Deck Should Focus on the MENA Region
A MENA-focused AI in agriculture PPT stands out because nearly every existing template ignores arid-land farming, water scarcity, saline soils, and greenhouse automation — the exact conditions that define agriculture in Egypt, Saudi Arabia, and the Gulf. Regional relevance is the fastest way to make your deck memorable in a sea of generic global slides.
Consider the reality on the ground. MENA is widely recognised as one of the most water-scarce regions on Earth, with several countries falling below the commonly used absolute-scarcity threshold of 500 cubic metres of renewable freshwater per person per year — a benchmark used by hydrologists and development agencies. Saudi Arabia's Vision 2030 explicitly targets food security and sustainable agriculture, pushing investment into vertical farms, hydroponics, and desert greenhouse projects where AI-controlled climate and irrigation are essential. Egypt's reclamation of desert land depends entirely on efficient water use — precisely the problem AI-driven precision irrigation exists to solve. Morocco has run notable national initiatives linking AI and smart farming to drought resilience.
Because water-per-capita figures vary by source and year, cite the body you are quoting — a national statistics authority, FAO AQUASTAT, or a World Bank MENA water report — directly on the slide. The credibility of a regional data slide comes from naming its origin, not from the size of the number.
Regional problems AI solves that global decks skip
- Water scarcity: AI irrigation that cuts consumption is not optional in MENA — it is the entry ticket.
- Soil salinity: coastal and over-irrigated soils in Egypt and the Gulf need the zone-level salinity mapping AI can provide. Salt-tolerant crops (halophytes) and salinity-aware planting decisions are an active area of regional agronomy.
- Extreme heat: AI-managed greenhouses regulate temperature and humidity to grow crops that could not survive open-field summers.
- Fragmented smallholdings: Egypt has a large base of small farms where affordable, smartphone-based AI diagnosis matters far more than expensive drones.
How to build a verifiable regional case-study slide
The single biggest credibility upgrade you can make is replacing an illustrative example with a documented one. Because this guide does not carry a first-hand deployment we can vouch for, the honest instruction is to source your own. Here is the template a strong case-study slide follows, so a reviewer can verify every line:
- Name the operation and location — "a specific greenhouse project in Al-Kharj" or "a reclaimed-land farm in Toshka," not "a farm in Saudi Arabia."
- State the dates — the season or year the system was deployed and the period the results cover.
- Give the baseline and the outcome — water use, yield, or grading accuracy before and after, with units.
- Attribute the data — a company case study, a university trial, a government agricultural report, or a peer-reviewed paper, with a link.
- Note the limitations — sample size, whether results were independently audited, and whether the vendor supplied the numbers.
A slide built this way is far harder to dismiss than a generic "AI saved 30% water" claim with nothing behind it. If you cannot find a verifiable local case, say so and present a clearly labelled modelled scenario instead. That transparency is itself a trust signal.
None of the top-ranking templates on SlideShare or SlideTeam address any of this. They show green rolling fields that look nothing like the landscape your audience actually farms. Swap a generic cornfield for a photo of a Saudi greenhouse or a Delta irrigation channel and the room instantly feels the deck was built for them.
For agri-tech founders, this gap is also a market opportunity. A localised AI advisory app or an e-commerce platform for agricultural inputs tuned to Arabic-speaking farmers faces relatively little direct competition. The presentation that names this gap positions you as the person who sees the market clearly.
Presenting in Arabic or bilingually
If your audience is Arabic-speaking, do not simply translate an English deck at the last minute. Three practical rules save you:
- Set the slide master to right-to-left before you write anything, or your bullet alignment and chart labels will fight you all the way through.
- Keep technical terms bilingual — write the Arabic term with the English in brackets on first use, especially for NDVI, IoT, and machine learning. Agronomists and investors often know the English form better.
- Use a font with proper Arabic support at 24pt or larger. Default Latin fonts render Arabic diacritics poorly on projectors.
6. Advantages and Disadvantages: The Slide That Wins Trust
The advantages of AI in agriculture include higher yields, reduced water and fertiliser waste, early pest detection, and labour automation; the disadvantages include high upfront cost, rural connectivity gaps, dependence on local data quality, and the risk of deepening chemical reliance. A balanced deck that names both earns far more credibility than a one-sided sales pitch.
Audiences — especially investors and academic reviewers — distrust presentations that claim a technology has no downsides. Put the comparison on a single two-column slide:
| Advantages | Disadvantages / Caveats |
|---|---|
| Higher yield through precision management | High upfront cost of sensors, drones, and software |
| Reduced water use via smart irrigation | Poor rural internet limits real-time systems |
| Early pest and disease detection | Models are only as good as the local data feeding them |
| Lower fertiliser and pesticide waste | Risk of deepening chemical reliance if misused |
| Labour automation for repetitive tasks | Skills gap — many farmers need training to adopt |
| Better yield forecasting for planning | Small farms may not reach ROI without subsidies |
Say this out loud during the presentation: AI does not replace agronomic expertise — it augments it. A model that recommends the wrong treatment because it was trained on foreign crops can do real damage. Local calibration matters. That nuance is what makes a deck feel authored by someone who has thought hard about the subject rather than someone who copied bullets from the first search result.
The connectivity reality in rural MENA
Real-time AI systems assume reliable internet, which many rural areas in Egypt and parts of the Gulf still lack. The honest workaround is edge computing — models that run locally on a device without a constant cloud connection. Mentioning this constraint and its solution signals genuine expertise. Anyone can list benefits; understanding why deployment is hard is what separates a practitioner's deck from a template download.
7. How to Present Market Data Without Fabricating Numbers
Present AI in agriculture market data by anchoring to widely cited, verifiable projections — such as the global market reaching roughly $47 billion by 2034 — and always attribute the figure rather than inventing precise statistics. Credible data slides use ranges and named drivers, not suspiciously exact numbers with no source.
The market-growth slide is where most decks either shine or lose the room. A defensible version includes three things: the projected market size and year, the growth trend, and the underlying drivers. Frame the ~$47 billion by 2034 figure as a projection from market research, not gospel — projections vary between firms, and saying so is more honest than pretending one number is definitive.
A verifiability note most decks skip: the "$47 billion by 2034" figure circulates across template sites without consistent primary attribution. Before it goes on a slide, trace it to the actual research report. Market-sizing figures for AI in agriculture are published by firms such as Precedence Research, MarketsandMarkets, and Grand View Research, and their numbers and target years differ. Cite the report title, the firm, and the publication year, and link to the firm's own page rather than to a template. If you cannot find the primary report behind a figure, that is a strong reason not to present it as fact — say "one widely repeated projection" and move on.
If you plan to publish your research, understanding the Artificial Intelligence in Agriculture journal APC will help you budget for Open Access publication fees before submitting your manuscript.
Growth drivers to name on the slide:
- Population pressure — global population approaching 10 billion by 2050, requiring roughly 70% more food, as reproduced in the widely shared SlideShare agriculture deck and traceable to FAO food-demand outlooks.
- Resource scarcity — declining arable land and freshwater forcing efficiency gains.
- Labour shortages — fewer people willing to do manual farm work, pushing automation.
- Falling sensor costs — IoT hardware getting cheaper, lowering the adoption barrier.
- Government initiatives — Saudi Vision 2030, Egypt's desert reclamation, and national food-security programmes.
A responsible presenter states the limitation clearly: market projections are estimates, and adoption in developing regions often lags the global figure because of cost and infrastructure. Including that caveat makes your data slide bulletproof. For background on how research organisations frame applied machine learning across sustainability topics, point curious audience members toward the Google AI research hub.
A 60-second source-check before any number goes on a slide
- Search the exact figure in quotation marks. If the only results are template sites and blog posts, it has no primary source.
- Find the publishing organisation — a research firm, a UN body, a university, or a government agency.
- Note the publication year. A 2019 projection presented in 2026 without a date is misleading by omission.
- Write the attribution directly on the slide in small type: Source: [Firm], [Report title], [Year].
- If steps 1–3 fail, either drop the number or label it "a widely repeated industry estimate."
8. Where to Find or Build an AI in Agriculture PPT Template
You can download AI in agriculture PPT templates from SlideShare, SlideTeam, and SlideEgg, or build a stronger custom deck in PowerPoint, Google Slides, or Canva using the structure in this guide. Downloaded templates save time but almost always need localisation and updated numbers before they are credible.
| Approach | Best for | Typical cost | Watch out for |
|---|---|---|---|
| Free SlideShare decks | Students needing fast reference material | Free | Outdated stats, generic non-MENA imagery |
| SlideTeam / SlideEgg premium templates | Professionals wanting polished visuals fast | Subscription or per-deck | Everyone else is using the same template |
| Canva custom build | Marketers who want a unique, branded look | Free tier or Pro | Time investment, some design skill needed |
| Google Slides from the structure above | Team collaboration and remote review | Free | Limited animation and chart polish |
| Fully custom (agency-built) | Investor pitches and client presentations | Highest | Longer turnaround, needs a clear brief |
Named resources worth knowing: SlideEgg's AI in Agriculture templates cover crop monitoring, automation, soil analysis, and sustainability, while SlideTeam's top AI in agriculture templates offer fully editable professional decks. Both are solid starting points — neither is MENA-tailored, which is exactly where your customisation adds value.
A faster build workflow using AI tools
- Draft slide copy by prompting ChatGPT with the 10-slide structure from section 2.
- Fact-check every statistic against a named primary source before it touches a slide.
- Localise imagery and examples for Egypt, Saudi Arabia, or the wider Gulf.
- Design in Canva or PowerPoint using the 6×6 rule and a two-colour palette.
- Rehearse out loud — a great deck badly delivered still fails.
The AI drafts the skeleton; your regional knowledge and attributed data make it credible. That division of labour is the smart way to use generative tools without letting them fabricate numbers on your behalf.
9. Design Rules That Separate Professional From Amateur
Content wins attention; design keeps it. Apply these to every slide:
- One idea per slide. If a slide needs two headlines, it is two slides.
- Six words per bullet, six bullets per slide, maximum. The classic 6×6 rule prevents wall-of-text death.
- Real imagery over clip art. Photos of actual drones, sensors, and greenhouses beat cartoon robots holding wheat.
- Consistent colour system. Two brand colours plus one accent. Earth-and-green palettes suit agriculture, but avoid the tired all-green cliché.
- Data visualised, not listed. Turn the market projection into a rising bar chart, not a sentence.
- Readable from the back row. Minimum 24pt body text; if you are shrinking type to fit, cut words instead.
- Source line on every data slide. Small type, bottom-left, always present.
If the deck is a business pitch rather than a class assignment, invest in a designer or a modern template. The difference in perceived credibility between a polished deck and a Times-New-Roman default is significant, and it affects whether investors take your agri-tech idea seriously.
10. Five Mistakes That Sink an AI in Agriculture Presentation
- Leading with the technology instead of the problem. Nobody funds a sensor. They fund a solution to a water bill.
- Unsourced statistics. A precise number with no attribution reads as invented — because it usually is.
- Zero downsides. A deck with only advantages tells the audience you have not stress-tested the idea.
- Generic imagery. American cornfields in a Gulf food-security pitch quietly signal that the deck was downloaded, not built.
- No call to action. Ending on "Thank you" wastes the only slide the audience stares at during Q&A. Put your ask there instead.
11. Practical Takeaways: Your Build Checklist
To build a standout AI in agriculture PPT: open with the food-security problem, define AI clearly, dedicate one slide to each of six use cases, add a named MENA case study, present balanced pros and cons, back it with attributed market data, and localise every visual. That checklist turns a generic download into a deck people remember.
- Start with the problem, not the technology. Lead with the 70%-more-food-by-2050 pressure so AI feels necessary, not decorative.
- Define your terms on slide three. Never assume the room knows what computer vision or predictive analytics means.
- One use case per slide. Problem, solution, payoff — in that order, every time.
- Add a regional case. A named Saudi greenhouse or Egyptian irrigation project with dates and data beats any generic example.
- Be honest about downsides. Cost, connectivity, and data quality deserve their own slide.
- Attribute your data. Name the research firm and year, and link the primary report.
- Localise the visuals. Swap rolling green fields for real MENA agricultural imagery.
- Rehearse against a clock. If you run long, cut a slide rather than talking faster.
- Close with a clear next step. Tell the audience exactly what to do with what they just learned.
If you are building this deck to pitch an agri-tech product or an online store selling to farmers, remember the presentation is only the front door. Behind it you need the actual technology — a working chatbot or software platform that delivers the AI advisory you are describing. A beautiful deck promising capabilities you cannot ship erodes trust fast. Build the substance first, then present it.
Frequently Asked Questions
What is AI in agriculture in simple terms?
AI in agriculture is the use of artificial intelligence — computer vision, machine learning, and sensor analytics — to help farmers monitor crops, analyse soil, detect pests, optimise irrigation, and forecast yields. In simple terms, it reads farm data faster than any human and turns it into precise decisions about when to water, treat, or harvest.
How many slides should an AI in agriculture PPT have?
Ten to fourteen slides suits a 15-minute presentation: title, problem, definition, core technologies, six use-case slides, a regional case study, advantages and disadvantages, market data, and a call to action. For a five-minute slot, cut to five slides: problem, definition, two use cases, and the call to action. Keep one idea per slide and follow the 6×6 rule.
What should an AI in agriculture PPT include?
It should include the food-security problem, a clear definition of AI, the four core technologies (computer vision, machine learning, IoT sensors, predictive analytics), six use-case slides covering crop monitoring, soil analysis, pest detection, machine vision, irrigation, and yield forecasting, a regional case study, balanced advantages and disadvantages, attributed market data, and a call to action.
How big is the AI in agriculture market?
Industry decks commonly cite a projection of roughly $47 billion by 2034 for the global AI in agriculture market. Treat this as one market-research estimate rather than a settled fact — Precedence Research, MarketsandMarkets, and Grand View Research all publish different figures and target years, so trace the number to the primary report and attribute it by firm and year. Growth is generally driven by population pressure requiring about 70% more food by 2050, water scarcity, labour shortages, and falling sensor costs.
Where can I download a free AI in agriculture PPT template?
Free and premium templates are available on SlideShare, SlideEgg, and SlideTeam, covering crop monitoring, automation, and sustainability themes. They save time but usually carry outdated statistics and generic non-regional imagery, so localise the visuals and refresh the market data before presenting to a MENA audience.
Why is AI in agriculture important for MENA countries like Egypt and Saudi Arabia?
MENA faces severe water scarcity, saline soils, and extreme heat that make efficient farming essential. AI-driven precision irrigation can cut water use, while greenhouse automation enables crops to grow in desert conditions — directly supporting food-security goals such as Saudi Vision 2030 and Egypt's desert-reclamation programme.
Can I use ChatGPT or Gemini to create an AI in agriculture presentation?
Yes. ChatGPT and Google Gemini can draft slide copy and structure quickly, but you must fact-check every statistic against a named source and localise the content yourself. Use AI to generate the skeleton, then add real regional examples, verified market data, and professional design — never let a generative tool invent numbers you will present as fact.
What are the disadvantages of AI in agriculture?
The main disadvantages are high upfront cost for sensors, drones, and software; unreliable rural connectivity that limits real-time systems; dependence on local training data (models trained on foreign crops misidentify regional diseases); a farmer skills gap; the risk of deepening chemical reliance if recommendations are misused; and weak ROI for small farms without subsidy support.
How do I make an AI in agriculture presentation in Arabic?
Set the PowerPoint or Google Slides master to right-to-left before writing, use a font with full Arabic support at 24pt or larger, and keep technical terms bilingual — write the Arabic term with the English abbreviation in brackets on first use for NDVI, IoT, and machine learning. Translate last, design first, and always re-check chart labels and bullet alignment after switching direction.
What images should I use in an AI in agriculture PPT?
Use real photographs of the technology and the landscape your audience recognises: drones over field trials, soil-moisture probes, greenhouse climate controllers, packing-line camera arrays, and — for MENA audiences — desert greenhouses, pivot irrigation, or Delta canal systems. Avoid cartoon robots, stock cornfields, and clip-art tractors, which signal a downloaded template rather than an authored deck.
The Bigger Picture
The next wave will not be about whether AI belongs in agriculture — that argument is over. It will be about who localises it fastest. The agencies, founders, and farmers who adapt global AI models to desert soil, brackish water, and Arabic-speaking smallholders will own a market the generic templates have not even noticed. A slide deck is just where that story starts.
If you want help turning an AI-in-agriculture concept into a working platform or a data-driven marketing strategy for your agri-business, reach out to the Aghrba team.
Sources & References
- Artificial Intelligence in Agriculture — SlideShare (secondary source reproducing population and food-demand framing; trace figures to FAO outlooks before citing).
- Artificial Intelligence in Agriculture.pptx — SlideShare (crop selection, risk, and pest-monitoring themes).
- AI in Agriculture PowerPoint and Canva Templates — SlideEgg.
- Top 10 AI in Agriculture PowerPoint Templates — SlideTeam.
- Google AI research hub (applied machine learning and sustainability background).
- OpenAI and Google Gemini (generative assistants referenced for photo-based diagnosis).
- ChatGPT (drafting workflow reference).
Note on figures: the ~$47B-by-2034 market size and the 70%-more-food-by-2050 statistic are widely reproduced industry estimates, not figures we independently verified. The template links above are secondary sources that repeat them. For a citable slide, trace each number to its primary research report — for market size, a named firm such as Precedence Research, MarketsandMarkets, or Grand View Research; for food demand, the FAO — and attribute it by title and year. For efficacy claims about specific use cases, prefer FAO publications, agricultural-university extension research, or peer-reviewed studies over template decks.
Last updated: 2026-08-04
Note: This article is for general informational purposes; verify specifics against your own context and primary sources.